Traffic doesn’t drive revenue; conversions do. You can double your visitors and still lose money if your store does not convert.
Your conversion rate is the percentage of visitors who take action and place an order.
In ecommerce, it is one of the clearest indicators of product-market fit, traffic quality, and store performance.
On Shopify, this metric tells you whether your store is working or leaking sales.
So, what is a good Shopify conversion rate?
In this guide, you’ll see real benchmarks, the factors that move the needle, and the exact areas to optimize to turn more traffic into revenue.
The Short Answer:
A good Shopify conversion rate typically falls between 1% and 3%, with high-performing stores reaching 3% to 5% or more. The ideal rate depends on your niche, traffic quality, pricing, and stage of growth.
To make smarter, data-driven decisions, explore our Shopify CRO insights and strategy guide.
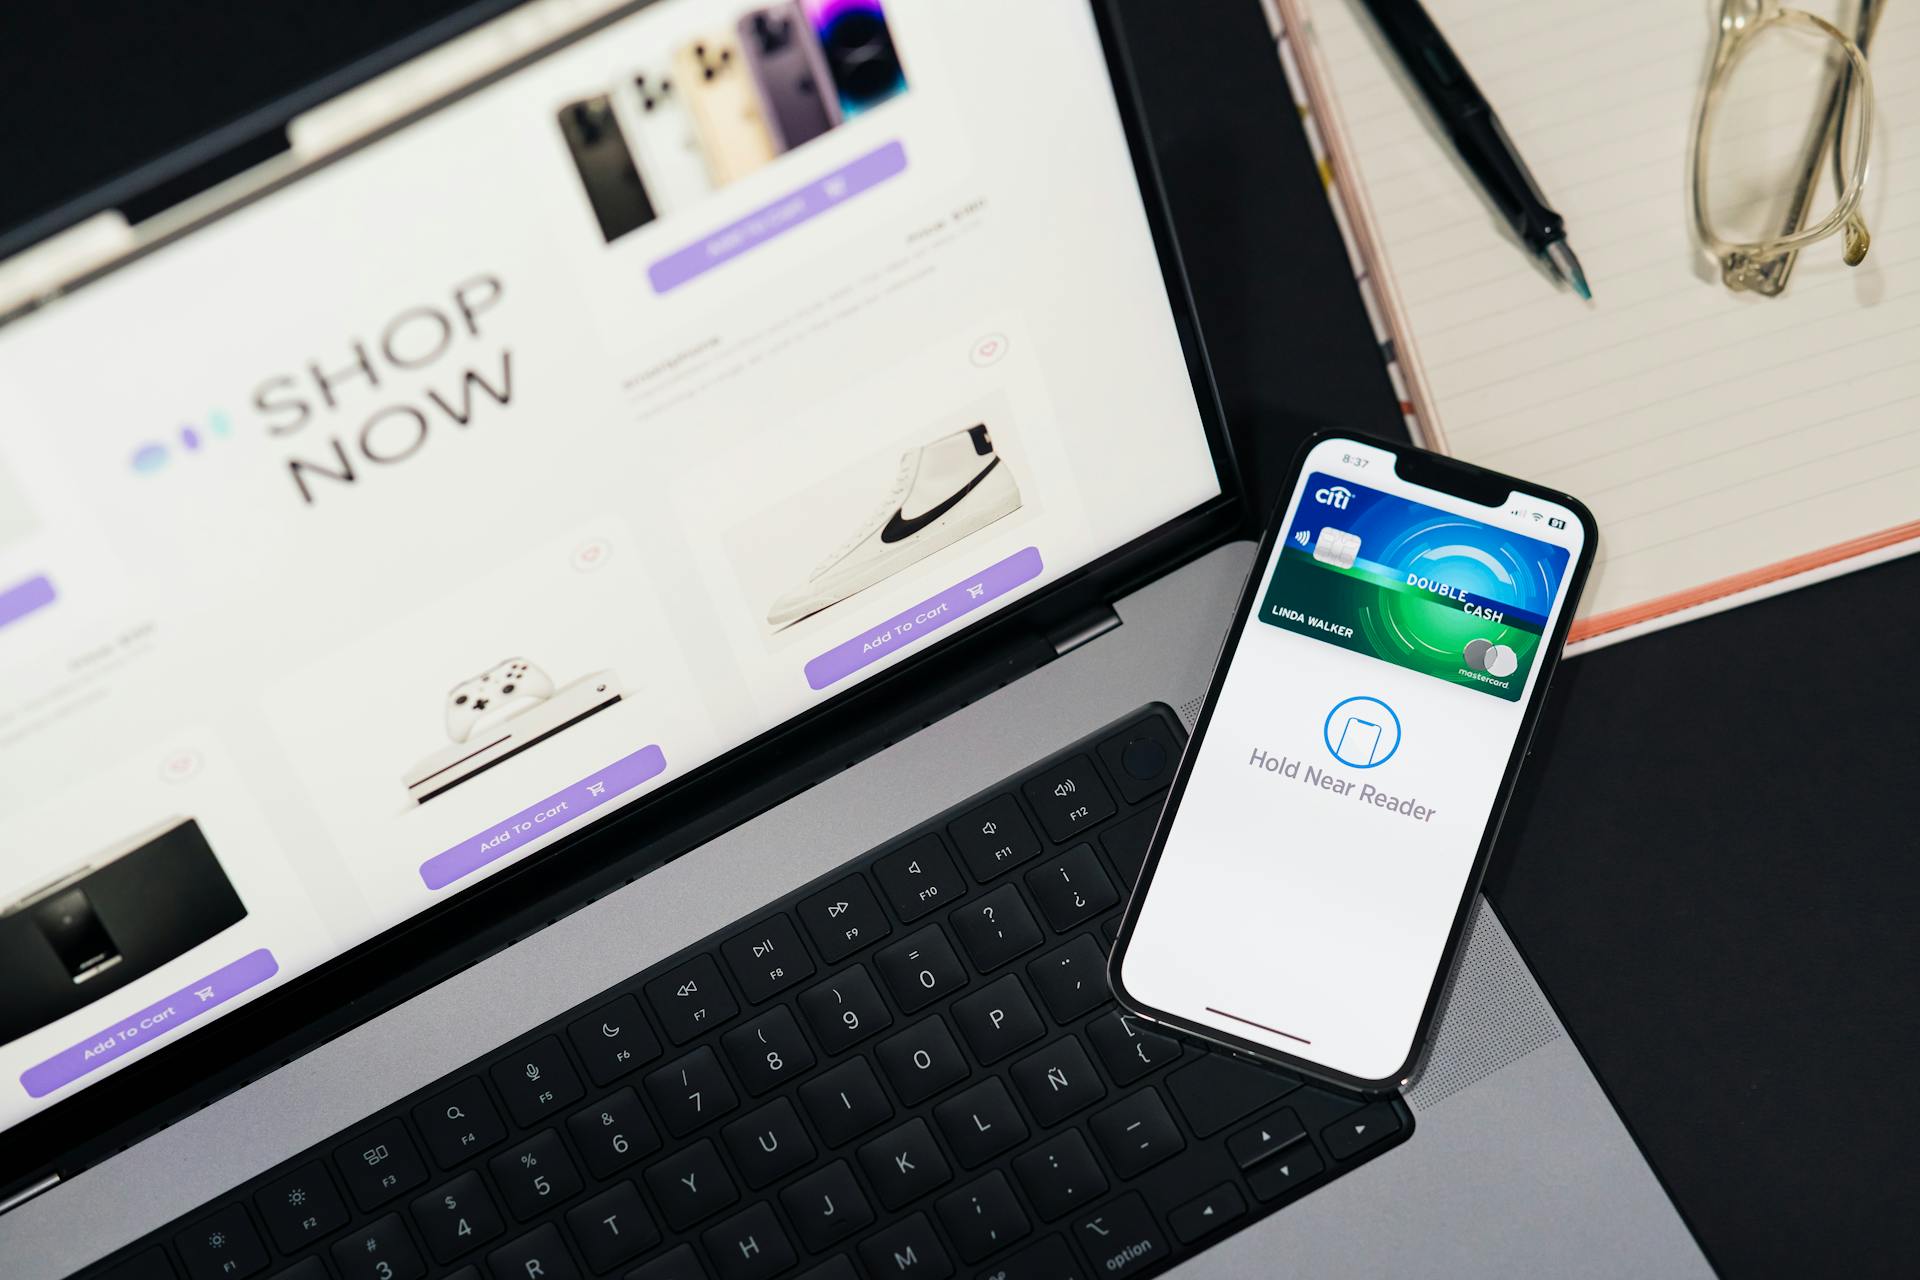
What Is a Shopify Conversion Rate?
A Shopify conversion rate measures the percentage of visitors who complete a desired action—most commonly, a purchase.
It tells you how efficiently your store turns traffic into revenue. Not attention. Not clicks. Revenue.
The formula is straightforward:
(Orders ÷ Visitors) × 100
If 1,000 people visit your store and 30 place an order, your conversion rate is 3%. That number reflects performance, not guesswork.
It shows whether your offer, pricing, messaging, and user experience are aligned.
Now, it’s important to understand the difference between sessions and users. A user is an individual visitor. A session is a visit.
One user can generate multiple sessions if they return to your store more than once. Most Shopify reports calculate conversion rate based on sessions, not unique users.
This means repeat visits are factored into performance. That matters when evaluating returning traffic and remarketing efforts.
On Shopify, a “conversion” typically refers to a completed purchase. However, some micro-conversions signal buying intent.
These include adding a product to the cart or reaching checkout. While they are not final sales, they reveal where friction exists in your funnel.
If many visitors add to cart but few complete checkout, the issue is not traffic. It is a process breakdown.
Conversion rate is not just a metric. It is a diagnostic tool.
Where to Find Your Conversion Rate in Shopify
You can find your conversion data inside the Analytics dashboard in Shopify.
Navigate to Analytics → Reports or view the overview dashboard for a high-level snapshot. This is where performance becomes measurable.
The primary metric to monitor is Online Store Conversion Rate. This reflects the percentage of sessions that resulted in a purchase. It is your core performance indicator.
However, do not stop there. Break the funnel down further.
- Add-to-Cart Rate shows the percentage of sessions where visitors added a product to their cart. A low number here suggests weak product pages, unclear value, or pricing resistance.
- Reached Checkout Rate measures how many visitors progressed from cart to checkout. If this drops sharply, your cart experience or shipping costs may be creating friction.
- Sessions Converted tells you the raw number of sessions that resulted in a purchase. This provides context alongside the percentage.
When you analyze these metrics together, patterns emerge. High traffic with low add-to-cart points indicates issues.
Strong add-to-cart but weak checkout completion signals trust or payment friction. The data will tell you where revenue is leaking—if you look closely.
What Is a Good Shopify Conversion Rate?
Industry Benchmarks
A “good” Shopify conversion rate is not a fixed number. It depends on traffic quality, pricing, niche, and brand strength. That said, benchmarks provide a useful reference point.
Across ecommerce, the average conversion rate typically falls between 1% and 3%. If your store sits within this range, you are performing at a standard market level. You are converting some demand, but there is room to improve efficiency.
High-performing stores often operate in the 3% to 5%+ range. At this level, the offer is clear, traffic is targeted, and the buying experience is smooth.
These stores usually have strong product-market fit and optimized product pages. They do not rely on hope. They rely on structure.
Top-tier stores can reach 5% to 8%+, and in some cases even higher for specific campaigns or warm audiences.
This level typically reflects brand trust, refined messaging, repeat customers, and well-optimized checkout flows. It is not accidental. It is engineered.
If you are below 1%, the issue is rarely “bad luck.” It usually signals weak traffic alignment, poor product positioning, slow site speed, pricing friction, or trust gaps.
The number tells a story. Your job is to interpret it.
Benchmarks by Traffic Source
Not all traffic converts equally. Source matters.
Paid ads traffic often converts lower than warm traffic because many visitors are discovering your brand for the first time.
Cold paid traffic may convert between 0.5% and 2%, depending on targeting and offer strength. If your paid traffic is converting above 3%, your funnel is likely well aligned.
Organic traffic, especially from search, can convert in the 2% to 4% range when intent is strong. Visitors searching for specific products often have buying intent.
However, informational blog traffic may convert much lower unless supported by strong product integration.
Email marketing typically produces the highest conversion rates. Warm subscribers who trust your brand can convert at 5% to 10% or higher, especially during promotions.
This is why list building is not optional. It is a performance lever.
The difference between returning and new visitors is also significant. Returning visitors often convert two to three times higher than first-time visitors.
If your new visitor conversion rate is low but your returning visitor rate is strong, your issue may be brand awareness rather than offer quality.
When evaluating your store, segment your data. A blended conversion rate hides opportunity.
Benchmarks by Niche
Conversion rates also vary by product category and price point.
- Fashion stores often see conversion rates between 1% and 3%. Buying decisions are visual and emotional. Fit uncertainty and sizing concerns can reduce conversion without a strong product presentation and clear return policies.
- Beauty brands can convert between 2% and 4%, especially when supported by reviews and social proof. Repeat purchasing behavior in this niche also increases overall performance over time.
- Electronics typically convert lower, often around 1% to 2%, due to higher price points and research-heavy buying behavior. Customers compare options before committing. Trust and detailed specifications matter here.
- Home & lifestyle stores vary widely but often fall within the 1.5% to 3.5% range, depending on product uniqueness and price.
Price plays a major role. Low-ticket products under impulse-buy thresholds tend to convert higher because the risk is low.
High-ticket products convert lower but can generate more revenue per order. A 1% conversion rate on a high-ticket offer can outperform a 4% rate on low-priced items.
So what is a good Shopify conversion rate for your store?
It is one that aligns with your niche, traffic source, and pricing model—while showing steady improvement through optimization. Benchmarks guide you. Your data decides.
Factors That Influence Your Shopify Conversion Rate
Your conversion rate is not random. It is the outcome of several controllable variables. When performance drops, one or more of these factors is usually misaligned.
Let’s break them down.
Traffic Quality
Not all visitors are equal.
Targeted traffic consists of people who are actively searching for what you sell. They have context. They have interest. They are more likely to buy.
Broad traffic, on the other hand, may generate clicks but not intent. Large numbers look impressive. Revenue tells the truth.
If you are running paid campaigns, targeting matters more than volume.
A smaller audience with clear buying signals will outperform a wide audience with vague interest. Precision improves conversion efficiency.
Buyer intent is the core driver. Someone searching for “best running shoes for flat feet” is closer to purchase than someone browsing “fitness tips.” Intent determines readiness.
If your traffic source brings in early-stage curiosity, expect lower conversion rates. If it brings in decision-stage buyers, your numbers will reflect that.
Before optimizing your store design, confirm you are attracting the right audience. Conversion begins before the click.
Website Speed & Mobile Optimization
Speed directly impacts revenue.
If your pages take too long to load, visitors leave. Every additional second increases drop-off. Fast-loading pages reduce friction and maintain momentum.
Test your homepage, product pages, and checkout. If delays exist, fix them before scaling traffic.
Mobile responsiveness is no longer optional. A large portion of ecommerce traffic comes from mobile devices.
If your store layout breaks, text overlaps, or buttons are difficult to tap, users will not struggle. They will exit.
Your checkout experience is where revenue is confirmed or lost. Long forms, forced account creation, or unexpected fees create friction.
A streamlined checkout with clear steps, visible costs, and multiple payment options increases completion rates. The goal is simple: reduce resistance at the final step.
If visitors reach checkout but do not complete the purchase, the issue is process—not product.
Product Pages
Your product page is your sales page. It must remove doubt.
- Product descriptions should focus on benefits before features. Explain how the product improves the buyer’s situation. Be specific. Vague claims reduce trust. Clear outcomes increase confidence.
- Images and videos reduce uncertainty. High-quality photos from multiple angles help customers visualize ownership. Demonstration videos can increase clarity and perceived value. The more tangible the product feels, the easier the decision becomes.
- Social proof reinforces credibility. Reviews, testimonials, and user-generated content reduce perceived risk. When customers see others satisfied, hesitation decreases. If traffic is strong but the add-to-cart rate is low, weak product presentation is often the cause.
Pricing & Offers
Price is both logical and emotional.
Competitive pricing does not always mean the lowest price. It means aligned with perceived value.
If your price is higher, your positioning and presentation must justify it. If your price is lower, ensure it does not signal low quality.
Free shipping remains a strong conversion driver. Unexpected shipping costs at checkout are one of the main causes of cart abandonment.
If free shipping is not possible, be transparent about costs early in the process.
Bundles and discounts can increase perceived value and urgency.
Limited-time offers, quantity discounts, or product bundles improve average order value while supporting conversion.
However, discounts should be strategic, not constant. Overuse weakens brand perception.
Pricing must support trust and clarity, not confusion.
Trust & Credibility
Trust removes hesitation. A secure checkout with visible security indicators reassures customers that their payment details are protected.
If security signals are unclear, doubt increases. Doubt lowers conversions.
A clear return policy reduces risk. Customers are more likely to buy when they understand what happens if the product does not meet expectations.
Ambiguity creates fear. Clarity builds confidence.
Visible contact information signals legitimacy. An accessible email address, support page, or contact form shows that a real business stands behind the store.
Hidden or missing contact details weaken credibility.
Conversion improves when risk decreases. Your store must feel reliable, transparent, and accountable.
Every one of these factors compounds. When traffic quality, user experience, product clarity, pricing strategy, and trust signals align, conversion rate improves.
When even one element breaks, performance suffers.
How to Improve Your Shopify Conversion Rate
Improving conversion rate is not about redesigning everything at once. It is about identifying friction and removing it systematically.
Small improvements at each stage of the funnel compound into meaningful revenue growth.
Let’s focus on what moves the needle.
Optimize Product Pages
Your product page carries the weight of the sale. If it underperforms, traffic volume will not save you.
Start with strong headlines. The headline should clearly state what the product is and who it is for.
Avoid clever phrases that require interpretation. Clarity converts. A visitor should understand the core benefit within seconds.
Next, write benefit-driven descriptions. Features explain what a product has. Benefits explain what it does for the buyer.
Instead of listing specifications alone, connect each feature to a real outcome. Show how it solves a problem or improves daily life.
Remove vague claims. Replace them with specific, believable advantages.
Finish with clear call-to-action buttons. The primary action—such as “Add to Cart” or “Buy Now”—should stand out visually and contextually.
Avoid competing buttons that dilute attention. If the next step is obvious, friction decreases.
When product pages improve, the add-to-cart rate follows.
Improve Checkout Flow
Checkout is where intent becomes revenue. Any unnecessary step reduces completion.
First, reduce form fields. Only ask for the information required to process the order. Long forms increase abandonment. Simplicity increases completion.
Second, offer multiple payment methods. Credit cards alone may not be enough. Digital wallets and alternative payment options improve accessibility.
The easier it is to pay, the higher the likelihood of purchase.
Third, enable guest checkout. Forcing account creation creates resistance. Some customers will not commit to an account before they trust the brand.
Allow purchase first. You can invite account creation after the transaction.
Audit your checkout from a customer’s perspective. If anything feels slow or unnecessary, remove it.
Use Social Proof
Uncertainty blocks conversions. Social proof reduces it.
- Customer reviews validate product claims. They provide third-party confirmation that the product delivers. Even a small number of authentic reviews can increase confidence significantly.
- User-generated content goes further. Photos or videos from real customers demonstrate real-world use. This lowers perceived risk and increases relatability. Prospects think, “If it worked for them, it can work for me.”
- Trust badges and visual reassurance elements reinforce security and legitimacy. Payment icons, satisfaction guarantees, and secure checkout indicators communicate safety quickly. They are not decorative. They reduce hesitation.
If your store lacks proof, buyers hesitate. Add credible signals and watch conversion improve.
Leverage Email & Retargeting
Not every visitor converts on the first visit. That is normal. Strategic follow-up captures lost revenue.
Abandoned cart emails remind users of unfinished purchases.
A well-timed reminder, sometimes paired with a small incentive, can recover a meaningful percentage of lost sales.
These visitors already showed intent. Re-engage them quickly.
Retargeting ads keep your brand visible to non-converting visitors.
Showing relevant products to people who have already browsed increases familiarity and trust. Familiarity improves conversion probability.
Post-purchase follow-ups strengthen retention and encourage repeat buying.
A thank-you email, usage tips, or a related product recommendation increases lifetime value.
Improving conversion rate is not only about first purchases. It is about building repeat customers.
A/B Testing
Optimization without testing is guesswork.
Start by testing headlines. Small changes in messaging can significantly affect engagement and add-to-cart rates.
Measure performance over a meaningful sample size before drawing conclusions.
Test pricing carefully. Even minor adjustments, or the way the price is presented, can influence perception.
Compare full price versus anchored discounts. Observe how conversion responds.
Test product images. Swap primary images, reorder galleries, or add lifestyle visuals. Monitor how these changes impact engagement and cart activity.
Finally, test offers. Free shipping versus percentage discounts. Bundles versus single products.
Limited-time promotions versus evergreen incentives. Let the data determine what resonates.
A/B testing creates structured improvement. Over time, incremental gains compound into higher conversion rates and stronger profitability.
Conversion growth is rarely driven by one dramatic change. It is the result of disciplined, continuous refinement.
Conversion Rate vs. Other Important Metrics
Conversion rate is powerful, but it does not operate in isolation.
A store can improve conversion and still struggle financially if other metrics are weak.
To evaluate performance properly, you must look at the full economic picture.
Revenue is the result of multiple moving parts working together.
Average Order Value (AOV)
Average Order Value (AOV) measures how much a customer spends per transaction. It is calculated by dividing total revenue by the number of orders.
A higher AOV allows you to spend more on acquiring customers while remaining profitable.
For example, a 2% conversion rate with a high AOV can outperform a 4% conversion rate with a low basket value. The quality of each order matters.
To improve AOV, focus on bundles, upsells, cross-sells, and free shipping thresholds. Encourage customers to add complementary products before checkout.
This increases revenue without increasing traffic.
When analyzing performance, always ask: Are we optimizing only for conversions, or for revenue per visitor?
Customer Acquisition Cost (CAC)
Customer Acquisition Cost (CAC) measures how much you spend to acquire one paying customer. This includes advertising spend, marketing tools, and related costs.
If your CAC is higher than your profit per order, your business model is under pressure, even if your conversion rate appears healthy.
Strong conversion reduces CAC by turning more visitors into buyers. However, high ad costs can still erode margins.
Monitor CAC alongside conversion rate. If you improve conversion, your cost per acquisition should decline, assuming traffic spend remains stable. That is operational efficiency.
A store with a modest conversion rate but low CAC can be more sustainable than a store with a high conversion rate and inflated acquisition costs.
Customer Lifetime Value (LTV)
Customer Lifetime Value (LTV) represents the total revenue a customer generates over their relationship with your brand.
This metric shifts the focus from single transactions to long-term value.
If LTV is high, you can afford higher acquisition costs. Repeat purchases change the economics of your store.
In this scenario, even a lower initial conversion rate can be acceptable if retention is strong.
To increase LTV, focus on post-purchase experience, email marketing, loyalty programs, and product quality. Retention multiplies profitability. Acquisition alone does not.
Why Conversion Rate Alone Doesn’t Determine Profitability
Conversion rate measures efficiency, not profit.
A store with a 5% conversion rate and low margins may earn less than a store converting at 2% with strong margins and high repeat purchase rates. Without context, the percentage is incomplete.
Profitability depends on the relationship between conversion rate, AOV, CAC, and LTV. These metrics interact. Improving one while ignoring the others creates an imbalance.
The objective is not to chase the highest conversion rate possible. The objective is to maximize profitable revenue per visitor over time.
Conversion rate is a leading indicator. Profit is the outcome. Focus on both.
When to Worry About Your Conversion Rate
Not every fluctuation requires intervention. Conversion rates move daily based on traffic mix, promotions, and seasonality.
However, certain patterns signal structural issues that demand attention.
Below 1%: Possible Traffic Mismatch or UX Issues
If your store consistently converts below 1%, especially with meaningful traffic volume, it is a warning sign.
Start with traffic alignment. Are you attracting people who actually want your product? Broad targeting, weak keyword intent, or misleading ad messaging can drive visitors who were never likely to buy.
In that case, the problem begins before they land on your site.
If traffic is relevant, examine user experience. Slow load times, confusing navigation, unclear product pages, and hidden costs reduce trust.
Even strong products fail when the presentation is weak.
Look at your funnel metrics inside your analytics dashboard. If the add-to-cart rate is low, the issue likely sits on the product page.
If add-to-cart is healthy but conversion remains low, checkout friction may be responsible.
Below 1% is not a death sentence. It is a signal to diagnose systematically.
Sudden Drop in Conversion Rate
A gradual decline suggests structural drift. A sudden drop suggests disruption.
If your conversion rate falls sharply over a short period, investigate immediately. Check for technical issues first.
Broken payment gateways, theme updates, app conflicts, or checkout errors can silently damage performance.
Next, review traffic sources. Did you scale a new campaign? Did your audience targeting change? A shift toward colder traffic can lower conversion quickly.
Also, examine pricing and shipping changes. Even small increases in cost or newly added fees can impact buyer behavior. Customers are sensitive to unexpected changes.
Do not guess. Compare time periods inside your analytics. Identify what changed before the drop occurred. Conversion rarely declines without cause.
High Add-to-Cart but Low Checkout Completion
This pattern is one of the clearest diagnostic signals.
If many visitors add products to the cart but few complete checkout, the issue is not interest. It is friction.
Common causes include high shipping costs revealed too late, limited payment options, forced account creation, long forms, or unclear return policies.
Buyers show intent, then hesitate at the final step.
Review your checkout flow from a customer’s perspective. Go through the process yourself on both desktop and mobile. Count the steps. Identify points where doubt may increase.
In many cases, improving checkout simplicity produces immediate gains without changing traffic or product strategy.
Realistic Goals for New vs Established Stores
Conversion expectations must match your store’s stage of growth. A new store and an established brand operate under different constraints.
Comparing them directly leads to poor decisions.
Set goals based on context, not aspiration.
New Shopify Stores
If your store is new on Shopify, your first objective is validation.
You are testing product-market fit, messaging clarity, and pricing alignment.
At this stage, the conversion rate is feedback. It tells you whether the market understands and values your offer.
Expect lower early conversion rates. Cold traffic, limited reviews, and low brand recognition reduce immediate trust. A 0.5% to 2% conversion rate during early testing is not unusual.
What matters is trend direction. Are improvements increasing engagement and add-to-cart behavior?
Focus on collecting clean data. Drive targeted traffic in controlled volumes. Analyze funnel steps. Identify friction points.
Do not scale ads aggressively before your store converts consistently. Scaling amplifies inefficiencies.
For new stores, stability matters more than speed.
Established Stores
Established stores operate with more leverage. They have brand awareness, reviews, returning customers, and historical data.
At this stage, the priority shifts from validation to optimization. Small percentage gains create a significant revenue impact because traffic volume is higher.
A 0.5% lift in conversion can translate into substantial incremental revenue.
Established brands should segment data carefully. Analyze performance by device, traffic source, product category, and customer type.
Refinement becomes precise. Testing becomes continuous.
When scaling traffic, protect the conversion rate. Rapid traffic expansion, especially from colder audiences, can dilute performance metrics.
Monitor blended conversion rate alongside segmented performance.
If the overall rate drops but new customer acquisition improves profitably, the shift may be acceptable. If both decline, pause and recalibrate.
Mature stores should balance acquisition and efficiency. Growth is sustainable only when conversion strength holds under scale.
Final Thoughts
A “good” Shopify conversion rate is not a universal number. It depends on your niche, traffic quality, price point, and stage of growth. Context defines performance.
Do not chase averages. Optimize your own funnel. Improve traffic alignment, strengthen product pages, reduce checkout friction, and measure results carefully.
Conversion rate is not a static metric. It is a moving indicator of how well your store converts attention into revenue. Test consistently. Refine deliberately. Let data guide every decision.
If you want consistent growth, follow this Shopify CRO roadmap and optimization guide.
FAQs
Is 2% a good Shopify conversion rate?
In most ecommerce markets, yes. A 2% conversion rate sits within the average range for many stores on Shopify.
However, “good” depends on context. If you sell high-ticket products, 2% can be strong. If you sell low-cost impulse items, there may be room to push higher.
Evaluate 2% against your niche, traffic quality, and profit margins—not against someone else’s screenshot.
Why is my Shopify conversion rate so low?
Low conversion usually points to one of three areas: traffic mismatch, weak product presentation, or checkout friction.
If visitors are not qualified, they will not buy. If product pages lack clarity or proof, trust drops. If checkout feels complicated or expensive, intent collapses.
Start by analyzing your funnel metrics. Check the add-to-cart rate first. Then checkout completion. The stage with the biggest drop typically reveals the real issue.
Does the traffic source affect conversion rate?
Yes, significantly.
Cold paid traffic often converts lower than warm email or returning visitors. Organic search traffic with buying intent can convert higher than social media browsing traffic.
Always segment conversion rate by source. A blended average hides performance differences.
Optimization decisions should be based on segmented data, not overall percentages.
What is a good mobile conversion rate?
Mobile conversion rates are typically lower than desktop due to smaller screens and shorter attention spans.
For many stores, a mobile conversion rate between 1% and 3% is common.
If your mobile rate is dramatically lower than desktop, review page speed, button visibility, and checkout usability. Mobile optimization is no longer optional. It directly impacts revenue.
How long should I wait before optimizing?
Do not optimize based on small data samples.
Wait until you have meaningful traffic volume—enough sessions to identify patterns rather than random variation.
For small stores, that may mean a few hundred targeted visitors. For larger stores, thousands.
Optimization is ongoing. You do not wait for perfection. You test, measure, adjust, and repeat. Consistency produces compounding gains.

Hi, I’m Ethan Caldwell. After transitioning from IT into eCommerce in 2017, I’ve spent the last 9 years building and optimizing Shopify stores. I focus on conversion rate optimization, breaking down what actually improves conversions into clear, practical insights.